

Features Highlight
- Provides a central point for record keeping and retrieval
- Provides detailed maps, drawings, equipment lists or photographs
- Can take into the field when planning new networks
- Existing documents can easily be linked to newly entered data
- Custom security features
- Provide controlled access throughout the organization, while giving each user the information they need.
- Access Control Lists (ACLs) and Task Based Security (TACLs) allow the administrator to place a security level on each database item and FiberBase® features
- Information displays can be customized for specific requirements
- Icons and desktops can be customized for individual users
- FiberOptic.com’s FiberBase professionals provide the training, technical support, database configuration, data entry and maintenance that our customers deserve
The client application is broken up into workspaces
Workspaces operate independently but changes in one are reflected in all others
Examples Include
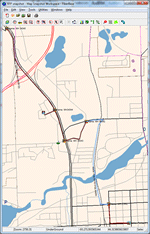
- Map Workspace
- Trace Workspace
- Sheath Segment Workspace
- Connection Workspace
- Explorer Workspace
| Workspaces Share Common Features | |
|---|---|
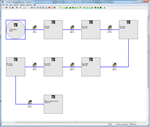
| Take an object that was displayed in one workspace and show it logically in another workspace. Transport Topology workspace can be showing a graphical view of the ports and conductors that exist from a transmitter to a receiver. This topology can be sent over to the Map Workspace to see how it is routed.
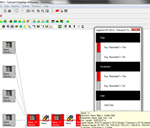
Take that same Transport Topology workspace and send it over to the Grab Bag Palette to create a report of all of the data attributes that make up the ports and conductors. Thematic coloring appropriate to the objects being displayed Project status, object status, object type, object owner, fiber is lit, is connected, leased, etc. Copy and paste to create new items.Copy a structure from one region and paste it in another region to create a new structure with duplicated equipment inside. |
A user can always access the Information Palette for a selected item.
This includes up to 30 graphical or data views related to the item that was selected (i.e. select a route and see the customer list, cross sectional view, sheath segment matrix, conductor list, duct hierarchy, etc). Many of the graphic views can be pushed to Visio to use as a starter for external reports. Ability to print the view. Ability to alter tooltips or data columns to show just the desired data. |


